
Solutions
Platform
Customers
Resources
Solutions
Platform
Resources

Two brands in the same category spent the same amount on creators in the exact same quarter through the same channel. One earned two euros of revenue for every euro it put in. The other earned sixteen. There was no budget advantage between them and no luck involved. They made different choices, and every one of those choices is sitting there in the data.
The most expensive misunderstanding in creator marketing is the belief that there is an industry number you are meant to hit. There is no number. There is a curve, and almost nobody sits at the average. Before we get to why, we should be precise about what the famous figure actually measures, because most of the confusion lives in the definition.
For a decade the channel was sold on one figure: roughly six euros back for every euro spent. It hardened into the benchmark, the pitch and the line everyone reached for on the board slide. Almost nobody who quotes it says what it actually measures, and that is the first problem.
The figure the industry quotes is ROAS, blended across brands and weighted by spend. Hold onto that last detail. It is where the benchmark quietly breaks.
Now plot every brand's realized ROAS from lowest to highest. You do not get a cluster around six. You get a climbing curve. The median brand returns about 2x, the bottom third loses money outright, the leaders clear 10x, and the very best reach close to 19x at scale.
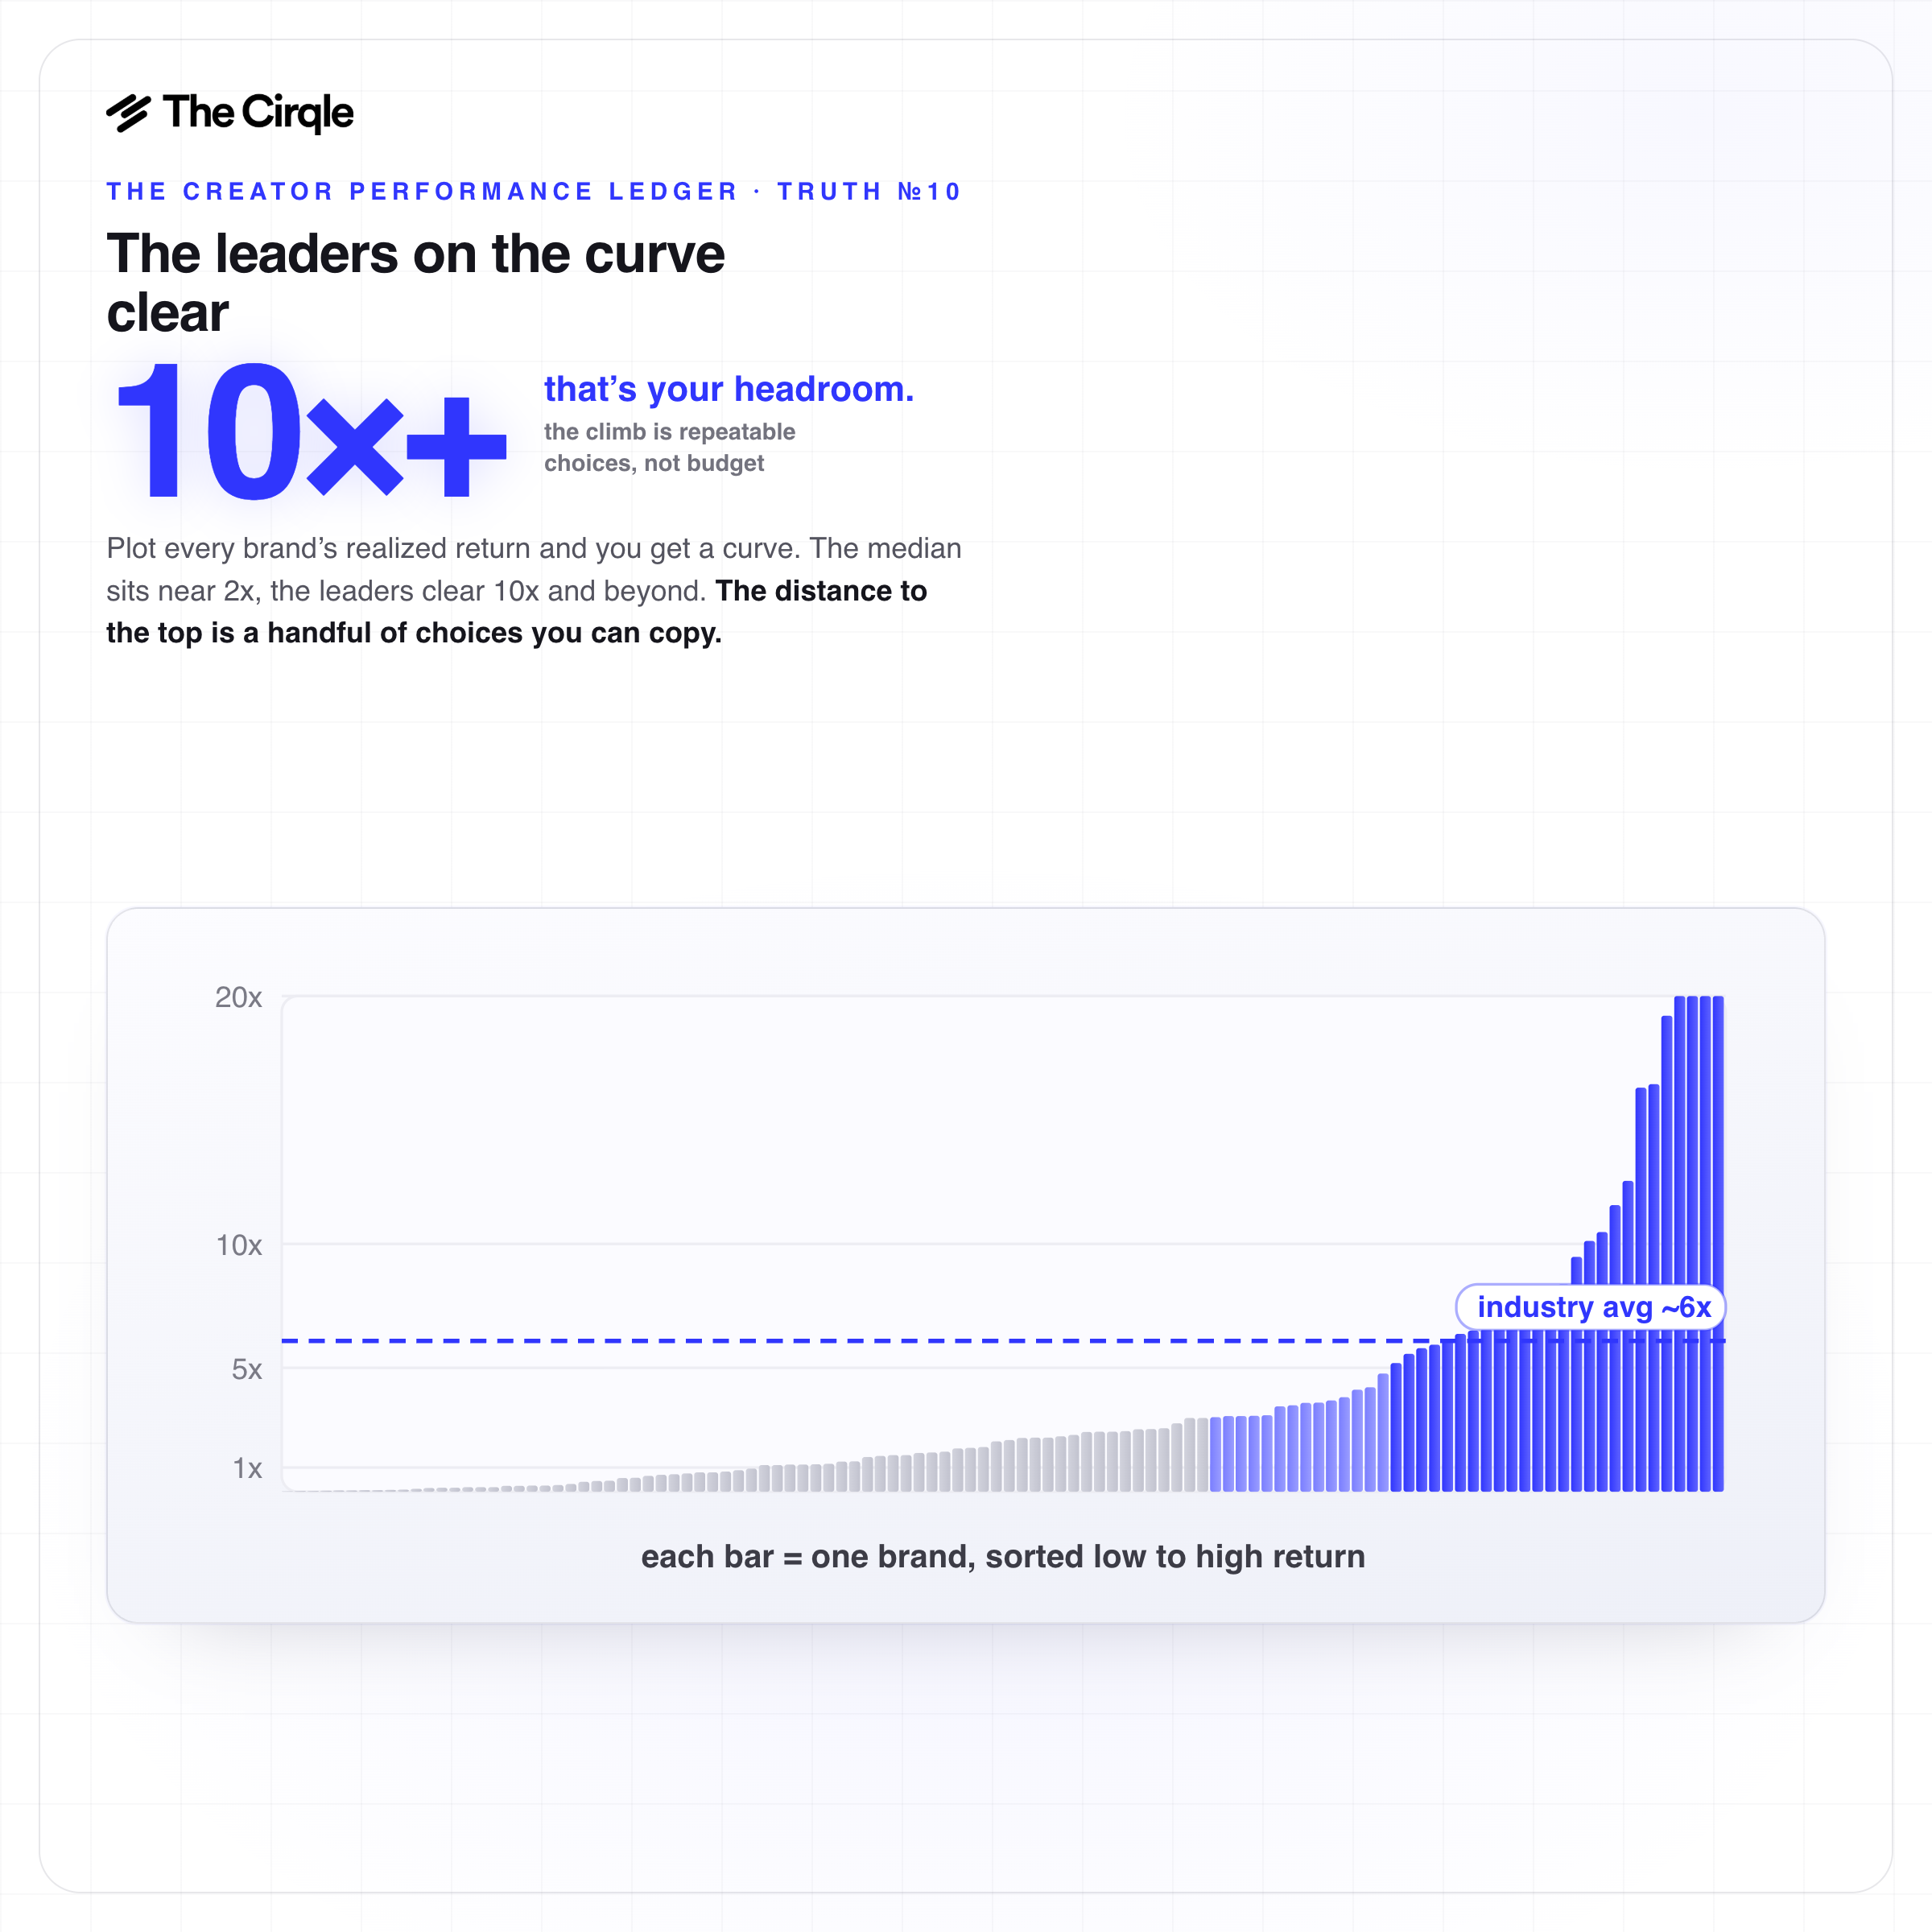
realized ROAS by brand, sorted low to high, with the blended 6x benchmark line and the ~2x median marker.
Six is the spend-weighted average of the ROAS curve, sitting low on the slope and dragged upward by a leading tier it does not resemble. Which is why quotes like “we hit 6x” can quietly mean you are running an average program while the leader in your category triples your ROAS on the same channel, with the same media, in the same quarter. In addition, completely ignoring the integration of attribution software like Northbeam, Triple Whale or Get Klar to have an accurate view on reporting.
The same ROAS number gets used three ways at once: as a target to aim for, as a benchmark to measure yourself against, and as a sign the channel is profitable. It fails at all three, each for a different reason
So 6x gets treated as a pass mark to clear and as the most you can expect, both at once. It is neither. The typical brand sits well below it, the leaders sit far above it, and because it counts revenue rather than profit, clearing it does not even prove the program made money. The number worth chasing is not the global 6x. It is the best ROAS in your own category, measured after margin rather than before. That is what tells you how much profit you are leaving on the table, and for most brands the gap is extremely wide.
Here is the part that should change how you operate and run your creator program. The distance between a 2x program and a 16x program is not money and it is not luck. It is a short list of repeatable choices, and each one is readable in the outcome data.
Stop buying creators. Start engineering matches. Five moves separate the leaders from the rest of the curve.
None of these is exotic. Each is a decision a brand can make on Monday. Together they are the climb.
Every one of those moves depends on a capability most brands still lack: connecting a creator and a creative to the revenue they actually returned. The industry leaned on reach and engagement for ten years, not because anyone believed they predicted sales, but because they were the only numbers easy to get. Measurement comes before everything else.
This is the work we built The Cirqle to do. We run our own MCP, an AI layer over the entire creator-performance dataset, with creator, creative, amplification and first-party conversion data held on one record. That closed loop is what lets us do the thing a benchmark never can. We place any brand on the curve, show which choices are holding it down, and forecast a creator’s return before a single euro is spent.
The old model treated creator marketing as a bet you justify after the fact. The curve treats it as a performance channel you engineer in advance.
The average is the average of everyone’s choices. Your return is the result of yours. The leaders are not working with a different budget. They are working with a different system, and the system is knowable.
We will run your numbers, show the choices moving you up, and forecast the return before you spend. Book a demo.
Give your team the power and speed they need to find the right partners and grow your brand.
%201.avif)