Solutions
Platform
Customers
Resources
Solutions
Platform
Resources

Two brands brief the same creator and pay the exact same fee. The first brand runs that one piece of content, reports on it, and moves on. The second brand produces a dozen similar pieces, finds the two that sell, and puts most of its media behind those two. A quarter later, the second brand pays a third of the first brand's cost per sale. Both used the same creator at the same fee. The difference came from how each brand spent the rest of its money.
A creator program has three separate costs and brands tend to confuse them consistently. We'd love to define them before going further.
1) The creator fee is the money you pay one creator to make one piece of content. It is the number on the creator's invoice. A brand pays around €508 to produce a Reel, €235 for a feed post, and €30 for a Story. Across the market, brands pay anywhere from €40 to €620 for a single piece, a sixteenfold range. You set that price mostly by choosing the format, and you barely move it by negotiating.
2) The portfolio cost is the money you spend producing many pieces at once, because you cannot tell in advance which one will sell.
3) The media/boosting/amplification cost is the media budget you put behind the creators and creative assets that work, to run them as paid ads.
Brands spend their energy on the first cost. They push the fee down, on average 37% below the opening ask, and they line-item the price of every piece. But the creator fee is about 23% of the total money a brand puts behind that creator. Amplification is the other 77%. The fee also barely predicts performance: we measured the correlation between what a creator charges and what that creator returns at 0.04. Inside a single brand's roster, a higher-priced creator returns about the same as a lower-priced one. Brands fight hardest over the smallest and least useful number on the page.
Creators quote higher rates as their following grows, so grouping them by tier and the price ladder is plain. We drew the figures below from 350,000 creator rate profiles on The Cirqle. These are organic rate-card numbers with baked in licensing fees for paid social rights (90 days length): they show what a creator charges and how far their content travels on its own, not what a customer costs to acquire.
A macro creator on Instagram charges about 24 times what a nano creator charges. You pay a lower CPM as you go up, because a larger account spreads the same rate over more views: a nano creator costs €329 per thousand views, and a macro creator costs €47. Micro creators reach the largest share of their followers at 15.7%, and macro creators reach 3.2%, which keeps the CPM gap narrower than the rate gap.
TikTok
The TikTok table reports cost per view, since that is the metric The Cirqle tracks there. A nano creator charges €253 a post at €0.35 per view, and a macro creator charges €2,460 at €0.50 per view. Micro creators give you the cheapest view at €0.27. Creators reach a far larger share of their followers on TikTok than on Instagram, from 14% at the nano tier to 61% at macro.
These rate-card averages run higher at the top than the realized cost per post earlier in this piece. Two things explain the gap: brands negotiate the asking rate down by about 37%, and the realized book skews toward the mid-market creators brands actually book. These are prices for a post and a view. Neither one predicts what a customer will cost you, which is where the rest of this piece goes.
About a third of the content brands produce with creators never gets a single dollar of media behind it. The instinct is to cut that third to save money but the data shows that cutting it does the exact opposite.
Look at where brands put the media that does run. Brands put 24% of their media behind their top 1% of assets, 52% behind the top 5%, 66% behind the top 10%, and 81% behind the top 20%. The median brand reaches 80% of its media with about 23% of its assets.
This is how the fundamentals of a portfolio work: brands produce many pieces because they cannot pick the winner before they run media dollars behind it. The data shows that organic performance does not equate to performance in paid social. But most brands still watch the early organic numbers only, and move budget to the few creatives that earn performance organically. The third that gets no media dollars today is typically ignored due to perceived poor brand-fit, low organic performance, or simply forgotten entirely.
Let's put some numbers on it: A brand commissions thirty pieces in a quarter across 15 creators. Ten creatives never get a euro of media dollars behind them. Of the twenty the brand does run, three carry roughly two-thirds of the budget, because the brand saw early that those three were worth scaling. A cost-cutter sees a third of the work wasted, sees the budget piled onto a handful of posts, and trims next quarter's production. The brand that understands the model sees it differently. It commissioned thirty so it could find three, and making all thirty was the only way to learn which three. Cut the twenty-seven and you shrink the pool your winners come from, and you buy a flatter return you cannot explain.
Finding the winner is half the job. Spending behind it is the other half, and that is where most of the money goes, because that is where the return is.
Most brands run a winning piece as a single ad. The best brands recut it into as many as eight variations, rebuilding the same idea for different audiences and placements, and they fund each variation as its own line of media. A winner is a starting point. The brands that pull ahead spend hard behind it.
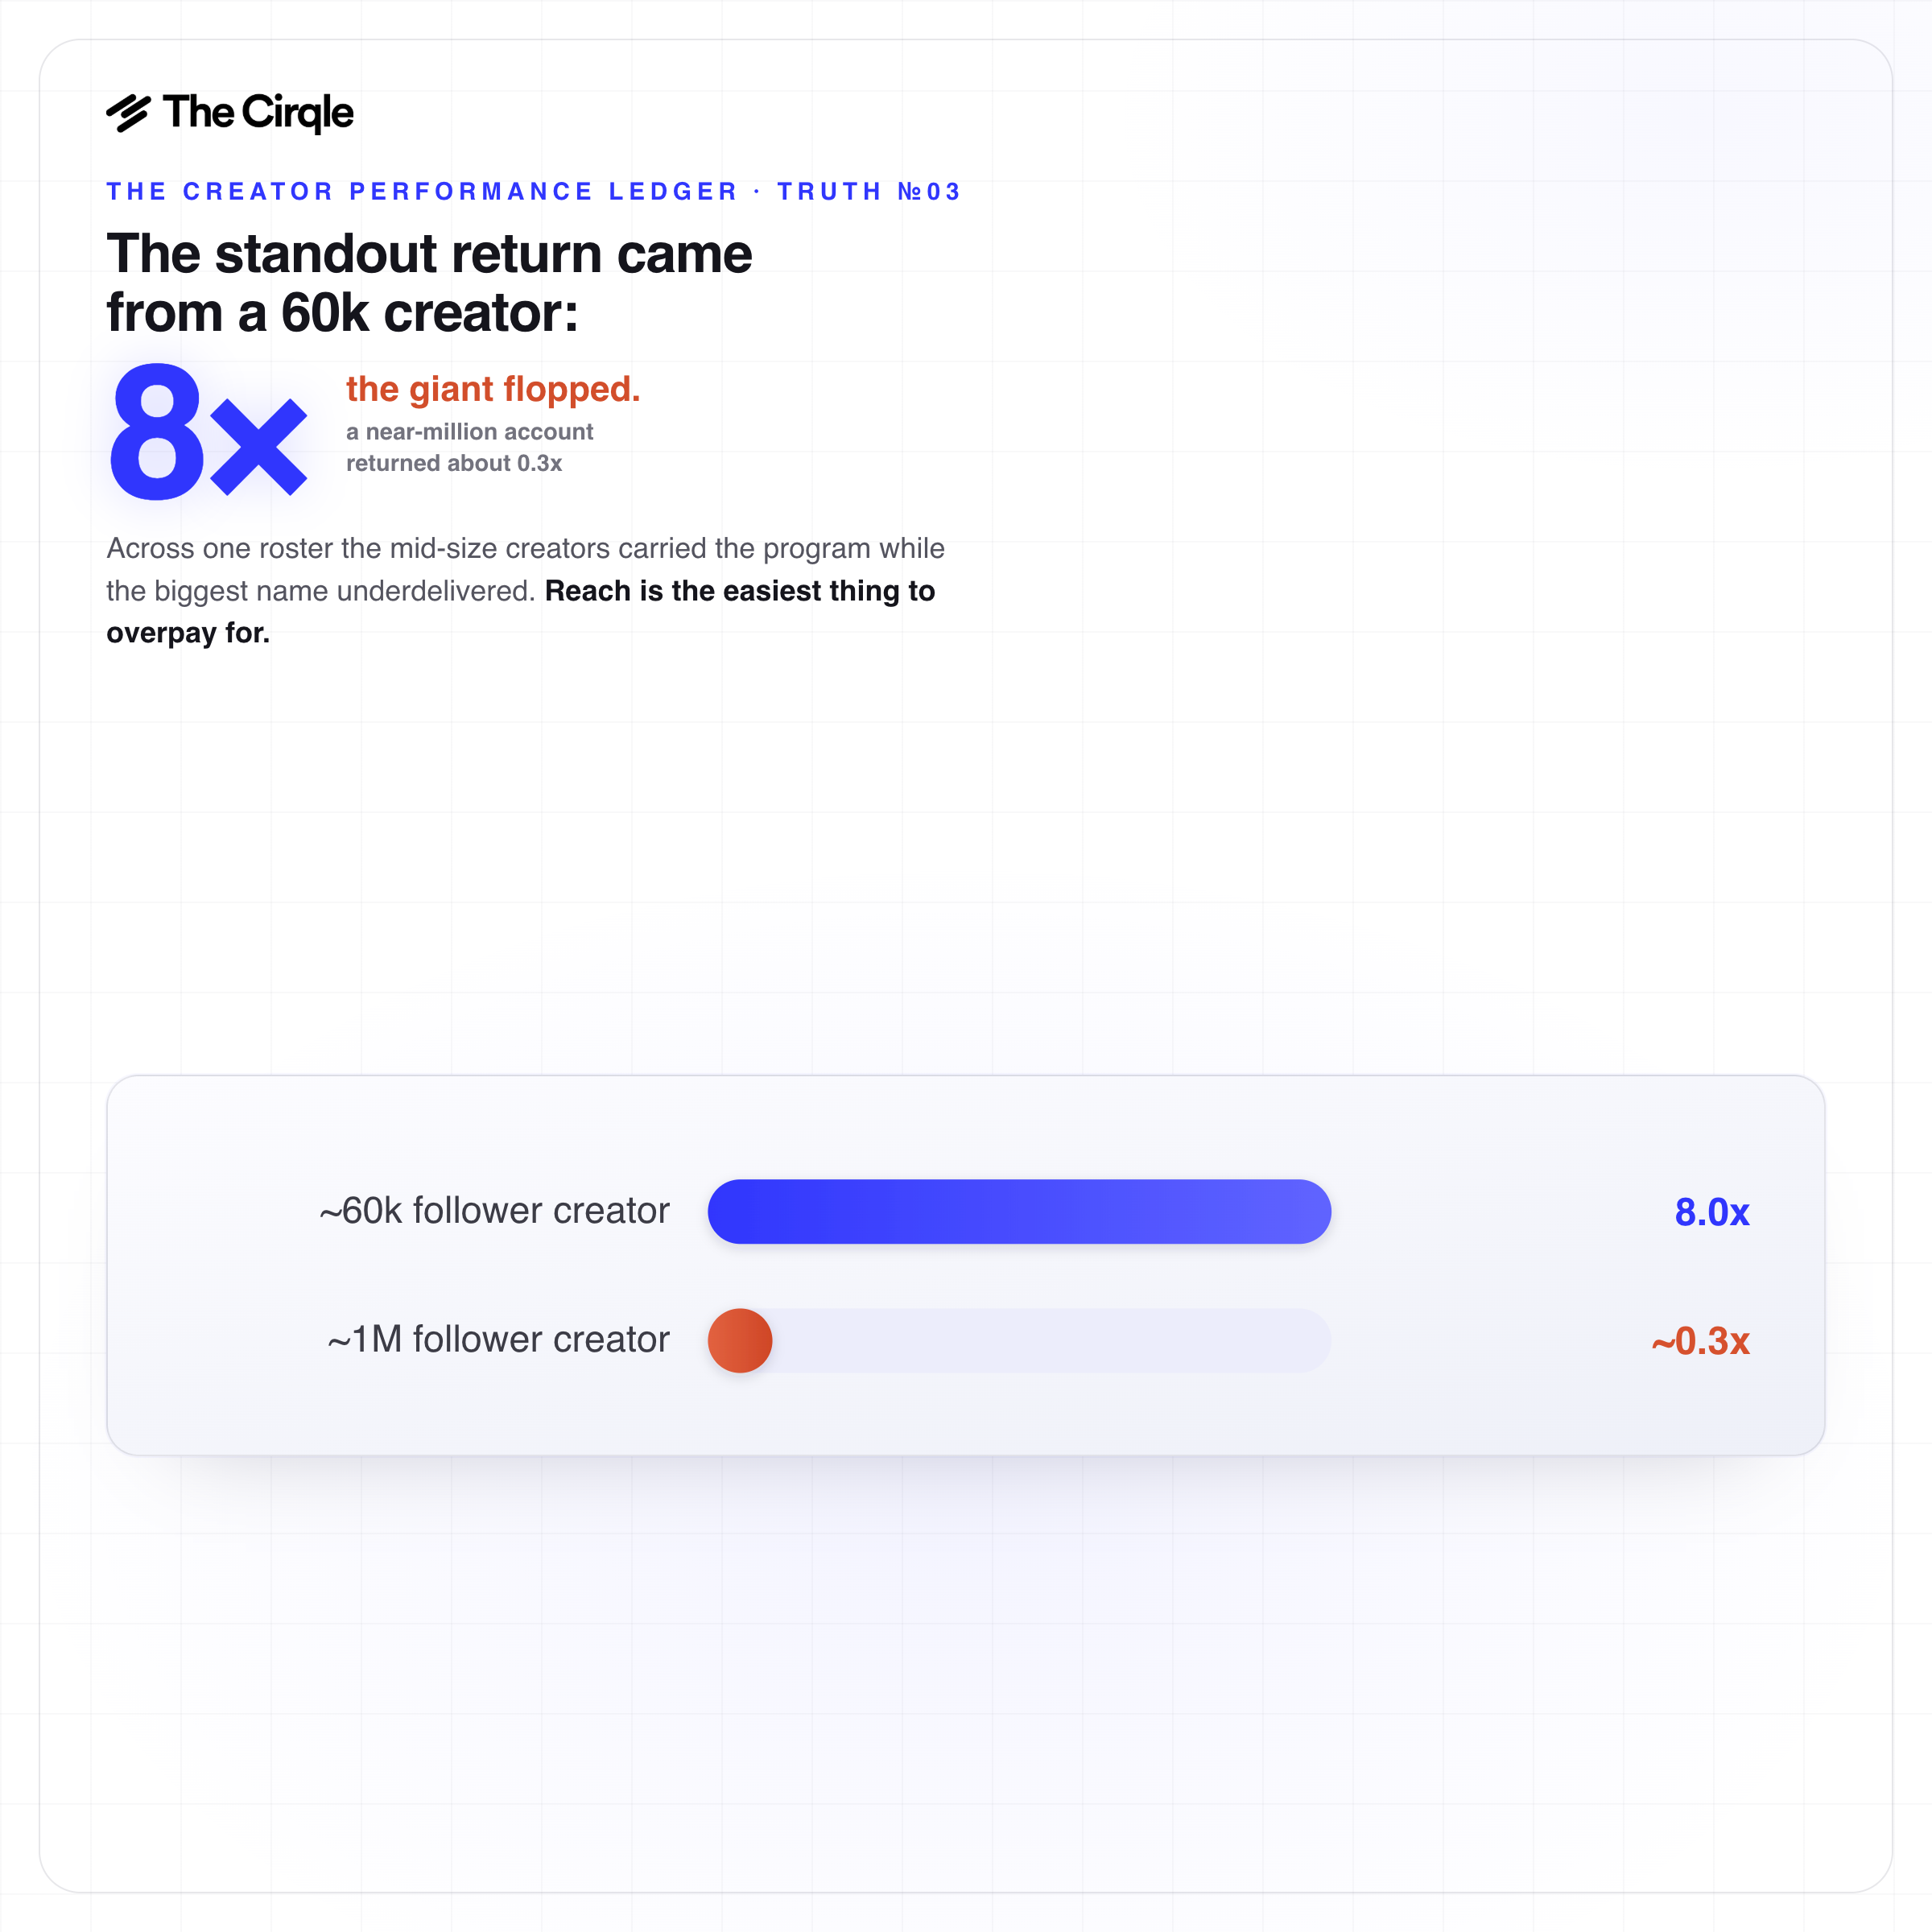
We traced creator programs to sales. Inside every brand we could trace, the link between what a creator charged and what that creator returned was flat or slightly negative. Paying up for the name does not pay you back.
The programs that returned the most ran more content and funded it harder. They produced around nine pieces where a smaller program produced two, and they put several times more total media behind them, at about the same price per piece.
Go back to the two brands from the start. The first brand put its budget into the creator: one well-known name at a premium fee, the two pieces that came with the deal, and a little media behind each. The second brand put its budget into the portfolio: several mid-priced creators, nine pieces between them, the weak ones left dark, and the media concentrated on the two that sold. Neither brand paid more for talent. The brand that funded the portfolio won.
One cost number is worth managing, and you do not negotiate it. Cost per outcome is what one customer cost you, measured against what that customer is worth. In our data the median is about €42 per sale, roughly 46% of an average order. Judge the portfolio on that number and you see where to push. Judge a single piece on its invoice and you learn nothing about whether it earned.
The leaders do not spend less, and they do not chase cheaper or more expensive creators. They stop pricing the single piece of content and start funding the portfolio. They produce enough to find the winners, then put their media behind the few that sell. You can run your program the same way. Commission widely, then concentrate your budget on the pieces that earn.
Book a demo to see where your spend actually goes.
Give your team the power and speed they need to find the right partners and grow your brand.
%201.avif)